Further considerations
This section summarizes information about the latency measurement, sampling, volumetry, and data.
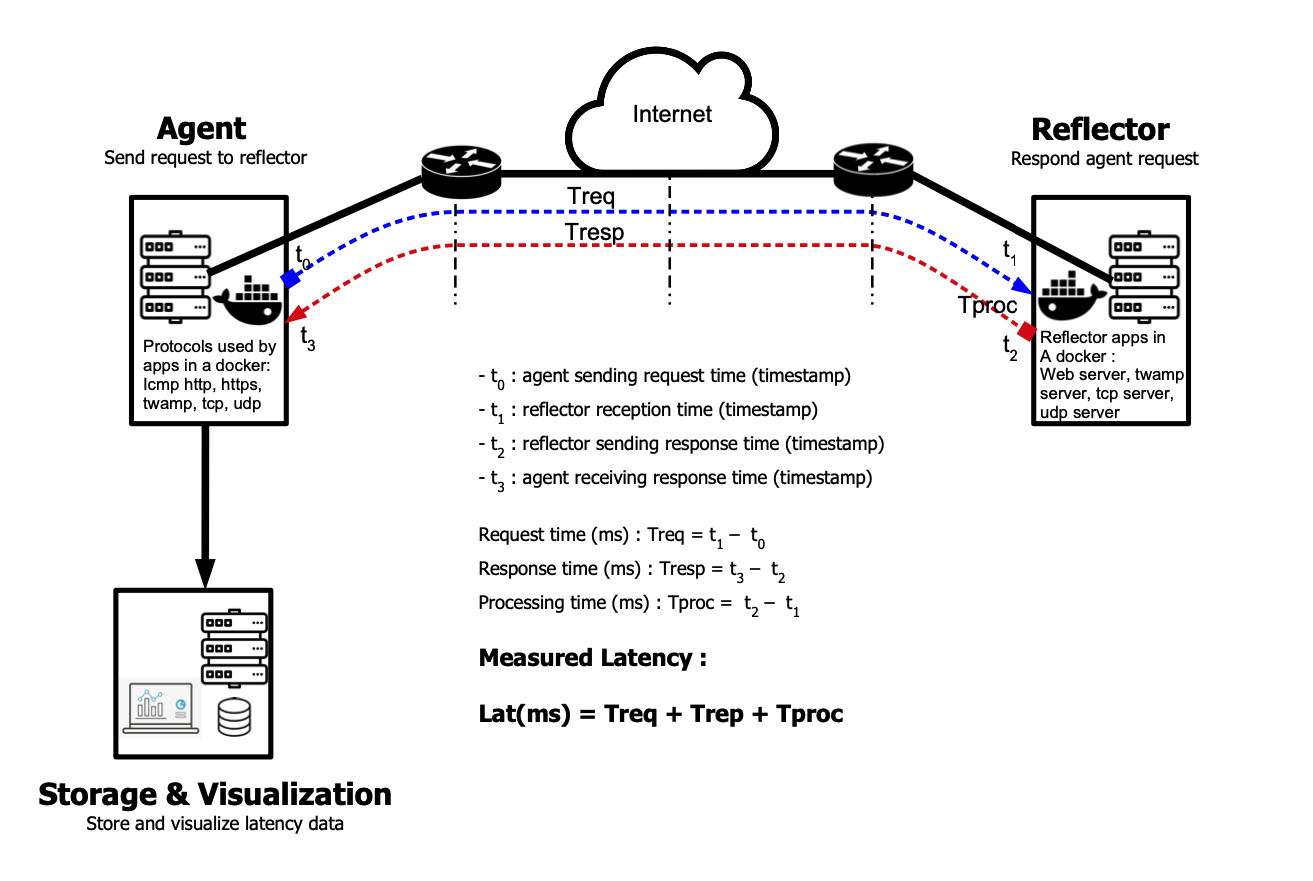
Latency measurement method
This diagram illustrate how do we calculate latency from the QoS-Agent.
Default sampling rates
Below are the default sampling rates. Refer to the Custom configurations section to learn how to modify them.
Note: Any modification to the configuration file of a running docker needs to be followed by a restart (stop, start) of the docker.
| Protocol | Sampling rate |
|---|---|
| TWAMP | every 2 seconds |
| ICMP | every 2 seconds |
| HTTP | every 2 seconds |
| HTTPs | every 2 seconds |
| TCP | every 2 seconds |
| UDP | every 2 seconds |
| TraceRoute | every 15 minutes |
| PacketLoss | every 5 seconds |
| Iperf3 | every 2 hours |
| Lifbe | every 1 hours |
Volumetry
Table below presents data consumption with a heavy configuration:
| Protocol | Sampling | Hourly consumption | Daily consumption | Montly consumption |
|---|---|---|---|---|
| TWAMP | 30 / min | 0.1 Mb | 2.4 Mb | 74.4 Mb |
| ICMP | 30 / min | 0.2 Mb | 4.8 Mb | 148.8 Mb |
| HTTP | 30 / min | 0.5 Mb | 12 Mb | 372 Mb |
| HTTPs | 30 / min | 0.6 Mb | 14.4 Mb | 446.4 Mb |
| TCP | 30 / min | 0.4 Mb | 9.6 Mb | 297.6 Mb |
| UDP | 30 / min | 0.4 Mb | 9.6 Mb | 297.6 Mb |
Other protocols
| Protocol | Sampling | Hourly consumption | Daily consumption | Montly consumption |
|---|---|---|---|---|
| TraceRoute | 4 / hour | 2.2 Kb | 53 Kb | 1.7 Mb |
| Iperf3 | 12 / day | 83 Mb | 2 Gb | 62 Gb |
| Lifbe | 24 / day | 4.3 Mb | 103.2 Mb | 3.1 Gb |
| PacketLoss | 12 / min | 4.3 Mb | 104.2 Mb | 3.1 Gb |