Dashboard description
Content
Once connected, you will have access this tools:
- Network status summary
- Multi-agent comparison
- Detailed latency charts
- Latency forecast
- Latency Heatmap
- Bandwidth
- LIFBE
Network Status Summary

On this compact dashboard above, we can see the main information for our network before seeing the details in the other dashboards.
First, make sure that the agent ID selected is the one for which you wish to view data (see it here).
We can analyze the following data:
- Connectivity quality indicators
- Stability: the network stability is computed based on standard deviation, drops, and events.
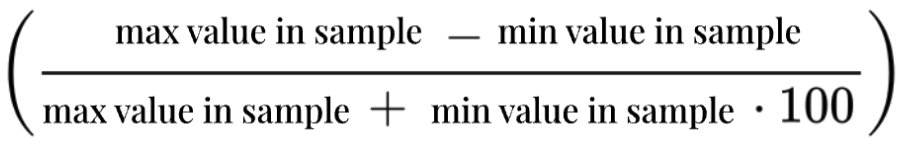
- Volatility: standard deviation of the latencies divided by the average. Having a low variability means that we have a stable network.
Volatility formula:
- Jitter: variation in time delay between when a signal is transmitted and received over a network connection, measuring the variability in latency. The formula is mean(abs(differences between values)). It analyzes all the values in the time range selected.
Example:
Let’s say we have 5 samples with the following latencies: 136, 184, 115, 148, 125 (in that order). The average latency is 142 - (add them, divide by 5). The jitter is calculated by taking the difference between samples.
136 to 184, diff = 48
184 to 115, diff = 69
115 to 148, diff = 33
148 to 125, diff = 23
(Notice how we have only 4 differences for 5 samples). The total difference is 173 - so the jitter is 173 / 4, or 43.25.
- Connectivity Health indicator
- This high level indicator takes into consideration stability, volatility, application latency and the threshold set in the agents (expected application latency and expected stability that must be defined at launch by user, 30 ms and 95% otherwise).
- It can indicate Good when the stability and latency thresholds are respected, Warning when one of the previous condition is not respected and Need attention as soon as the stability and latency thresholds are not respected with a 20% margin.
- Agent informations (3) are some of the metadatas about the selected agent.
- Agent ID: Unique identifier for the device that is collecting data.
- Agent Name: Agent or site name. Must be defined at launch by user, empty otherwise.
- Hardware: Type/model of equipment where the agent is installed. Must be defined at launch by user, empty otherwise.
- Address: Agent's physical address. Must be defined at launch by user, empty otherwise.
- Network name: Name of the network used by the probe to reach the reflector (if applicable). Must be defined at launch by user, empty otherwise.
- Network type: Network type used (4G, 5G, WIFI, etc). Must be defined at launch by user, empty otherwise.
- Details: Raw text field for more details about this agent. Must be defined at launch by user, empty otherwise.
- Docker version: Version of the QoS-Agent used.
- Latency indicators
- Application: the application latency is the mean of the HTTP, HTTPs, TCP and UDP latencies.
- Expected application latency: correspond to the threshold the user created when initializing the agent
- Network: the network latency is the mean between ICMP and TWAMP latencies.
- Latency by protocol
- Latency history
- Bandwidth indicators
- Bandwidth data with TCP and UDP upload speed and download speed.
- The bandwidth history data over the last 12 hours.
Detailed latency charts

On this detailed latency chart dashboard above, we can see the detailed information of latency for each protocol.
First, make sure that the agent ID selected is the one for which you wish to view data (see it here).
Then you can analyze the following data:
- The mean latency for each protocols for the selected time range .
Latency forecasting

On the Latency forecasting dashboard above, we can see charts given by a statistical model.
First, make sure that the agent ID selected is the one for which you wish to view data (see it here).
After, you can analyze the following data:
- The latency forecast interval, in milliseconds .
- The confidence level of the forecasting .
- The current average latency compared to the forecasted one for the last 5 minutes and the forecasting min, max and mean for the next minute .
Latency Heatmap

On this heatmap dashboard, we can visualize the latency measurement in space gathered by a QoS-Agent in motion (for example with the MobileLatency app).
First, make sure that the agent ID selected is the one for which you wish to view data (see it here).
Then you can analyze the following data:
- The heatmap created by the QoS-agent in motion .
LIFBE

On this new bandwidth dashboard, we can see the details of the LIFBE metrics. We also now use LIFBE, a new protocol for measuring bandwidth.
First, make sure that the agent ID selected is the one for which you wish to view data (see it here).
Then you can analyze the following data:
- LIFBE data with TCP and UDP upload speed and download speed.
- Jitter data with download and upload speed.
- Some network details with the Interface chosen and Subtype of the measures.
- The LIFBE history data over the last 12 hours .
Bandwidth

On this bandwidth dashboard, we can see the details of the bandwidth metrics. For measuring bandwidth we use an Iperf tool inside the QoS-Agent.
First, make sure that the agent ID selected is the one for which you wish to view data (see it here).
Then you can analyze the following data:
- Bandwidth data with TCP and UDP upload speed and download speed.
- The bandwidth history data over the last 12 hours .
Multi-agent Comparison

On the Multi-agent comparison dashboard, we can select more than 1 agent ID (1) and display their network informations in order to compare it.
First, select on the top left the agent ID for which you wish to compare data. You can select 1, 2 or more agent ID and their respective panels will appear one below the other.
We can visualize data from the Network Status Summary dashboard as well as data from the Bandwidth dashboard.